Research Blog · Visual explainer
Same Training Loss,
Different Behavior:
Which Solution Should We Choose?
From choosing training solutions to learning data mixtures for LLM fine-tuning.
Which data should an LLM learn from? Answering that question means evaluating the models training produces. But a training objective can leave more than one solution to choose from.
Equal training loss can hide different outcomes.
Minimizing training loss may leave many solutions, with different validation performance. Training alone does not tell us which solution should guide the next update. In this toy example, gradient descent from different initializations approaches different points on the same set of training solutions.
Same training fit. A better choice.
1. Models that minimize training loss
Blue curve: training-loss minimizers
Dashed paths: gradient descent (GD)
GD step 120 / 120 · Same step size η = 0.16
Background: training lossLowerHigher
2. Validation score for each model
One bar per model, in the same order. Taller means a higher score.
How this toy example is computed
The loss is , where h is a smooth cubic interpolation of the curve in my presentation. Its graph is the blue set of zero-loss solutions. The background and paths use this same loss.
Each run uses , with η = 0.16 for 120 steps. The three initializations are chosen so the runs approach A, B and C. Their final losses are below 10−16; the paths are computed, without projecting onto the curve. Playback slows the early iterations so their movement is visible.
The validation scores are schematic values from the presentation, not experimental measurements. This illustrates dependence on initialization; it does not assert convergence for every starting point or step size.
The challenge is to make that choice part of the optimization.
Select, then differentiate.
We propose a select-then-differentiate template [1]: first choose a training solution using the objective we ultimately care about, then compute the hypergradient at that selected solution to guide the outer update.
For LLM data reweighting, our practical method explores candidate LoRA updates [2], selects the one with the lowest validation loss, then differentiates through that update to adjust the training-data mixture.
- Explore
- Evaluate
- Select
- Update
Data-source weights
Training proportions p(θ)
Share of training data from each of 10 sources.
Neural-network parameters
Four candidate LoRA updates
Same architecture; different parameter values.
Validation loss
Compare losses; choose the lowest.
Use the selected candidate to update the data-source weights
Differentiate through the selected parameters to update the source weights, then repeat.
The template, in formulas
x denotes model parameters; θ controls source proportions .
1. Define training and validation losses
Training
Validation
Ls is the average loss on source s; Lval is the held-out validation loss.
2. Select using validation loss
Among training minimizers, choose the model with the lowest validation loss.
3. Differentiate at the selected solution
Evaluate every derivative at . The formula translates the validation gradient through the training curvature into a gradient for the mixture controls. The dagger (†) denotes the pseudoinverse, which handles flat training directions.
Here validation loss has no direct dependence on θ. The exact formula holds under the paper’s local PŁ and regularity assumptions, including a unique validation-optimal selection for nearby θ. The LLM animation uses finite candidate updates as a practical approximation.
Selection happens while learning the data mixture. The resulting mixture is then used for final fine-tuning, before the model is evaluated on test questions.
What changed in practice?
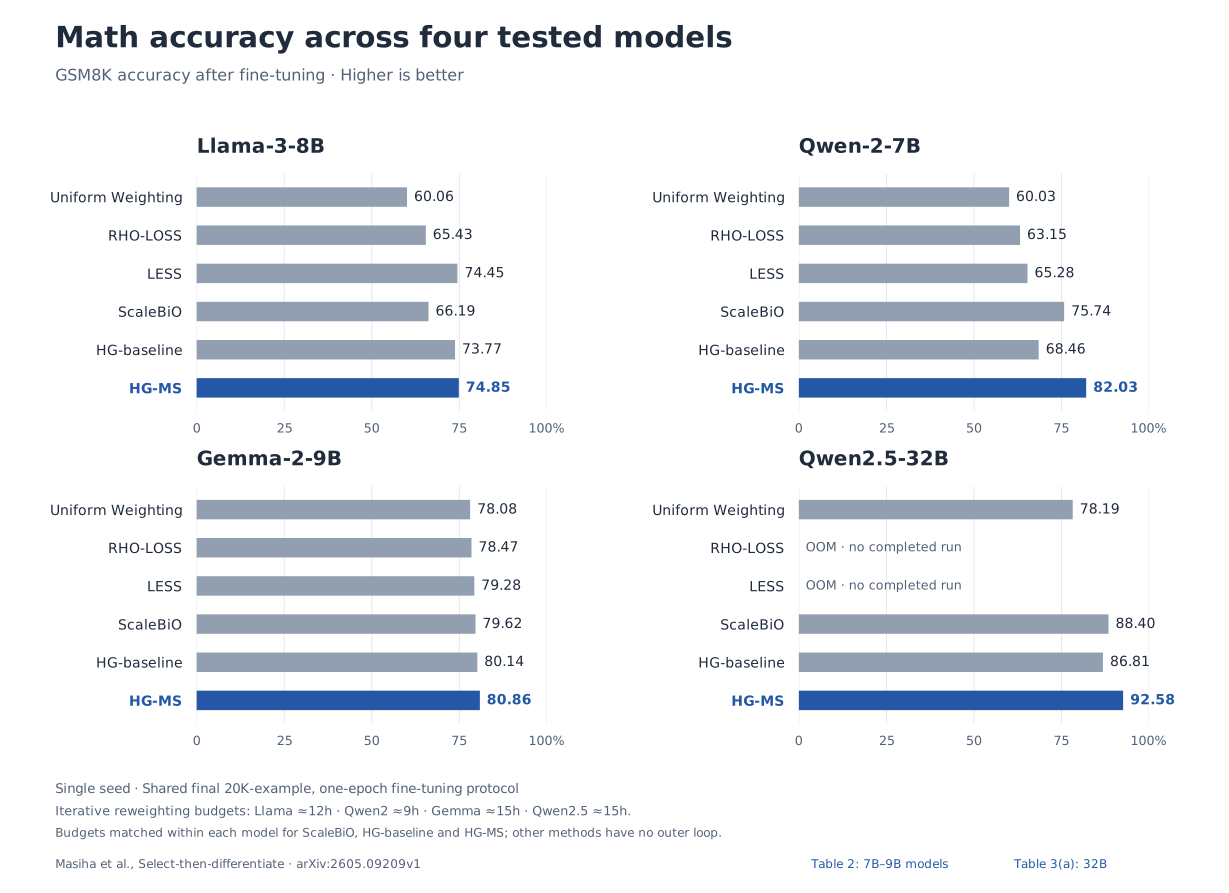
Higher math accuracy across four tested models. HG-MS, our select-then-differentiate method, achieved the highest reported GSM8K and MATH accuracy among completed runs on all four models. Below is the GSM8K comparison; the full results include both benchmarks.
Comparing methods across four models
Shared 0–100% scale · HG-MS (ours) in blue.
Llama-3-8B
Qwen-2-7B
Gemma-2-9B
Qwen2.5-32B
Full results, protocol & downloads
Both benchmarks report test accuracy (%); higher is better. OOM denotes an out-of-memory run. These are single-seed measurements (seed 2424), not averages or evidence of statistical significance.
| Method | GSM8K | MATH |
|---|---|---|
| Uniform Weighting | 60.06 | 30.24 |
| RHO-LOSS | 65.43 | 25.89 |
| LESS | 74.45 | 29.93 |
| ScaleBiO | 66.19 | 30.58 |
| HG-baseline | 73.77 | 30.49 |
| HG-MS (ours) | 74.85 | 30.86 |
| Method | GSM8K | MATH |
|---|---|---|
| Uniform Weighting | 60.03 | 30.26 |
| RHO-LOSS | 63.15 | 33.40 |
| LESS | 65.28 | 29.24 |
| ScaleBiO | 75.74 | 36.93 |
| HG-baseline | 68.46 | 34.27 |
| HG-MS (ours) | 82.03 | 38.98 |
| Method | GSM8K | MATH |
|---|---|---|
| Uniform Weighting | 78.08 | 37.29 |
| RHO-LOSS | 78.47 | 37.35 |
| LESS | 79.28 | 38.00 |
| ScaleBiO | 79.62 | 37.98 |
| HG-baseline | 80.14 | 38.23 |
| HG-MS (ours) | 80.86 | 38.48 |
| Method | GSM8K | MATH |
|---|---|---|
| Uniform Weighting | 78.19 | 43.30 |
| RHO-LOSS | OOM | OOM |
| LESS | OOM | OOM |
| ScaleBiO | 88.40 | 51.29 |
| HG-baseline | 86.81 | 46.82 |
| HG-MS (ours) | 92.58 | 53.32 |
The compared methods include RHO-LOSS [3], LESS [4], and ScaleBiO [5]. All numerical results shown here come from our paper [1].
Each completed run uses a final 20,000-example fine-tuning set and one training epoch, with a common evaluation protocol within each model. These are the paper’s adapted baseline implementations under a single-H100 setup.
For the iterative methods (ScaleBiO, HG-baseline, and HG-MS), reweighting time is matched within each model: approximately 12 hours for Llama-3-8B, 9 for Qwen-2-7B, and 15 for Gemma-2-9B and Qwen2.5-32B. The noniterative baselines have no outer reweighting horizon. Experimental protocol.
Download both benchmarks (CSV) · Download GSM8K figure (SVG)
A closer look: Qwen-2-7B
HG-MS reached 82.03% GSM8K accuracy, compared with 75.74% for ScaleBiO, the strongest comparator here. Its learned mixture also emphasized a different source: DART-Math rather than MathInstruct.
The three iterative methods below use the same ten-source portfolio and nine-hour reweighting budget. Each final mixture supplies 20,000 examples for one epoch of fine-tuning.
Same ten sources. Different final mixtures.
Final sampling weights · Each ring totals 100%.
ScaleBiO
99.6%
MathInstruct
HG-baseline
99.6%
MathInstruct
HG-MS (ours)
94.0%
DART-Math
HG-MS shifts the emphasis from MathInstruct to DART-Math in this experiment.
Source weights & comparison details
All three runs use the same ten-source portfolio and nine-hour reweighting budget. These are sampling weights, not exact counts of sampled examples. For the comparators, the remaining weight is grouped as “remaining sources”. DART-Math’s individual weight is not reported for either comparator; it is included in that remainder, not assumed to be zero.
| Method | Source | Weight (%) |
|---|---|---|
| ScaleBiO | MathInstruct | 99.6 |
| SlimOrca | 0.1 | |
| GPT4-LLM-Cleaned | 0.1 | |
| HG-baseline | MathInstruct | 99.6 |
| GPT4-LLM-Cleaned | 0.3 | |
| SlimOrca | 0.0 | |
| HG-MS | DART-Math | 94.0 |
| MathInstruct | 5.6 | |
| Orca-Math | 0.4 |
HG-MS’s 0.4% Orca-Math share is shown at the reported precision. A rounded 0.0 does not establish an exactly zero weight. This single-seed comparison does not imply that DART-Math is best for every model, or separate the mixture’s effect from the rest of the procedure.
Download reported source weights (CSV) · Experimental protocol
References
- Select-then-differentiate: Solving Bilevel Optimization with Manifold Lower-level Solution Sets. NeurIPS, 2026.
- LoRA: Low-Rank Adaptation of Large Language Models. ICLR, 2022.
- Prioritized Training on Points that are Learnable, Worth Learning, and not yet Learnt. ICML, PMLR 162:15630–15649, 2022.
- LESS: Selecting Influential Data for Targeted Instruction Tuning. ICML, PMLR 235:54104–54132, 2024.
- ScaleBiO: Scalable Bilevel Optimization for LLM Data Reweighting. ACL, pp. 31959–31982, 2025.
Cite this post
@misc{masiha2026sametrainingloss,
  author = {Masiha, Saeed},
  title = {{Same Training Loss, Different Behavior: Which Solution Should We Choose?}},
  year = {2026},
  month = oct,
  howpublished = {Saeed Masiha's Research Blog},
  url = {https://smasiha.github.io/writing/same-training-loss/},
  note = {Published 16 October 2026}
}